R语言编程
20230722_ggplot2绘图优化 : Y轴截断解决大数据差异显示问题
780

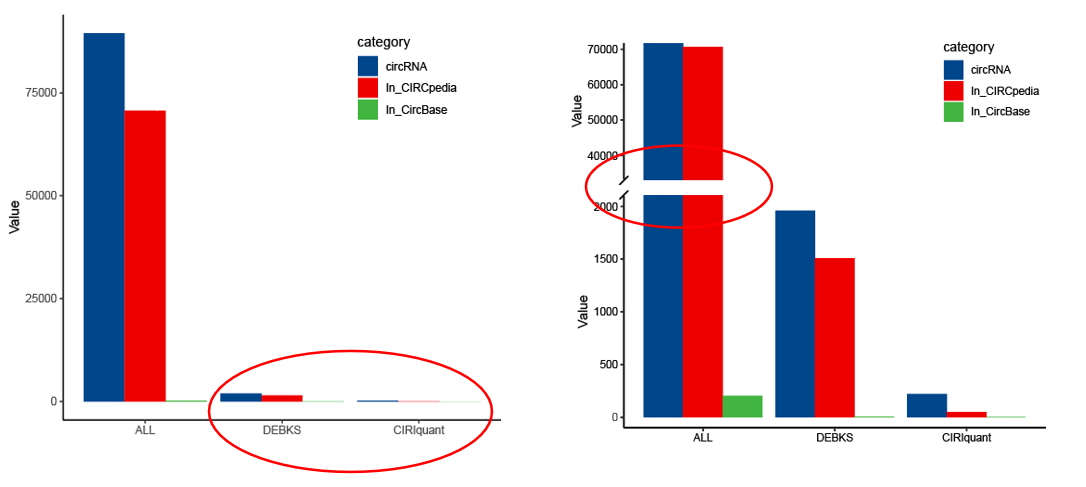
对实验数据绘图过程中,经常会遇到数值相差很大的情况;若相差极大,很难做到多组数据都显示的明显;这个时候,就可以通过截断坐标轴来实现多组数据都清晰显示的要求。截断坐标轴是只显示一部分数据,使相差较大的多组数据都能明显的显示出来。
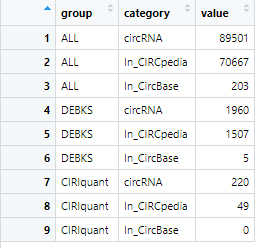
(1)测试数据:
library(ggplot2)
library(cowplot)
library(grid)
#BiocManager::install("ggsci")
library(ggsci)
df <- data.frame(
  group = factor(c("ALL", "ALL", "ALL", "DEBKS", "DEBKS", "DEBKS", "CIRIquant", "CIRIquant", "CIRIquant"),levels= c("ALL","DEBKS","CIRIquant")),
  category = factor(c("circRNA", "In_CIRCpedia", "In_CircBase", "circRNA", "In_CIRCpedia", "In_CircBase", "circRNA", "In_CIRCpedia", "In_CircBase"),
                    levels = c("circRNA", "In_CIRCpedia", "In_CircBase")),
  value = c(89501, 70667, 203, 1960, 1507, 5, 220, 49, 0)
)

(2)生成Y轴未截断的柱形图:
p1 <- ggplot(df, aes(x = group, y = value, fill = category)) +
  geom_bar(stat = "identity", position = position_dodge()) +
  theme_classic() +
  #theme_get()  +
  scale_fill_lancet() +
  ylab("Value") +
  xlab("Group")
p1
ggsave("p1.pdf", plot = p, device = "pdf",width = 7, height = 5)
(3)Y轴截断的柱形图:
# 创建下部分的柱形图
p1 <- ggplot(df, aes(x = group, y = value, fill = category)) +
  geom_bar(stat = "identity", position = position_dodge()) +
  theme_classic() +
  #theme_get()  +
  scale_fill_lancet() +
  ylab("Value") +
  xlab("Group") +
  coord_cartesian(ylim = c(0, 2000)) +
  theme(axis.title.x = element_blank(), plot.title = element_blank()) +
  annotation_custom(grob = linesGrob(gp = gpar(lty = 2, lwd = 1, col = "black")),
                    xmin = -Inf, xmax = Inf, ymin = max(df$value), ymax = max(df$value))
p1
# 创建上部分的柱形图
p2 <- ggplot(df, aes(x = group, y = value, fill = category)) +
  geom_bar(stat = "identity", position = position_dodge()) +
  theme_classic() +
  scale_fill_lancet() +
  ylab("Value") +
  xlab("Group") +
  ggtitle("Barplot with ggplot2") +
  theme(plot.title = element_text(hjust = 0.5)) +
  coord_cartesian(ylim = c(35000, 70000)) +
  theme(axis.text.x = element_blank(), axis.title.x = element_blank(), axis.ticks.x = element_blank(), axis.line.x = element_blank()) +
  annotation_custom(grob = linesGrob(gp = gpar(lty = 2, lwd = 1, col = "black")),
                    xmin = -Inf, xmax = Inf, ymin = min(df$value), ymax = min(df$value))
# 组合两个图形
p2 <- plot_grid(p2, p1, ncol = 1, align = "v", axis = "l", rel_heights = c(0.4, 0.6))
# 显示图形
print(p2)
ggsave("p2.pdf", plot = p2, device = "pdf",width = 7, height = 5)
(4)两种绘图结果对比:

(5)其它可参考方法:
https://www.freesion.com/article/2832405902/
标签:
rstudio
北京 天气
晴
-7℃


