生物信息学
20210318_WGCNA_加权基因共表达网络分析
305

20210318_印楝_WGCNA分析
(1)WGCNA (加权基因共表达网络分析) 是一种系统生物学方法,用于分析高通量基因表达数据。该方法可以识别共表达的基因集,这些基因集具有高度相关性,通常与生物学过程、细胞类型和疾病状态相关联。
(2)WGCNA 通过构建基因共表达网络来实现这一点,其中节点表示基因,边表示它们之间的相关性。然后,将网络分成不同的模块(也称为基因集),其中每个模块代表一个共同表达的基因集。这些模块可以与临床特征相关联,从而揭示潜在的生物学机制和治疗靶点。
(3)WGCNA 已被广泛应用于许多生物学领域,如癌症研究、神经科学和植物基因组学等。它是一种有力的工具,可用于研究基因调控网络和发现与疾病相关的生物标志物。
WGCNA分析需要两个文件:
(1)基因表达矩阵:genes.TMM.EXPR.matrix
(2)样品分组以及表型信息:sample_information.txt
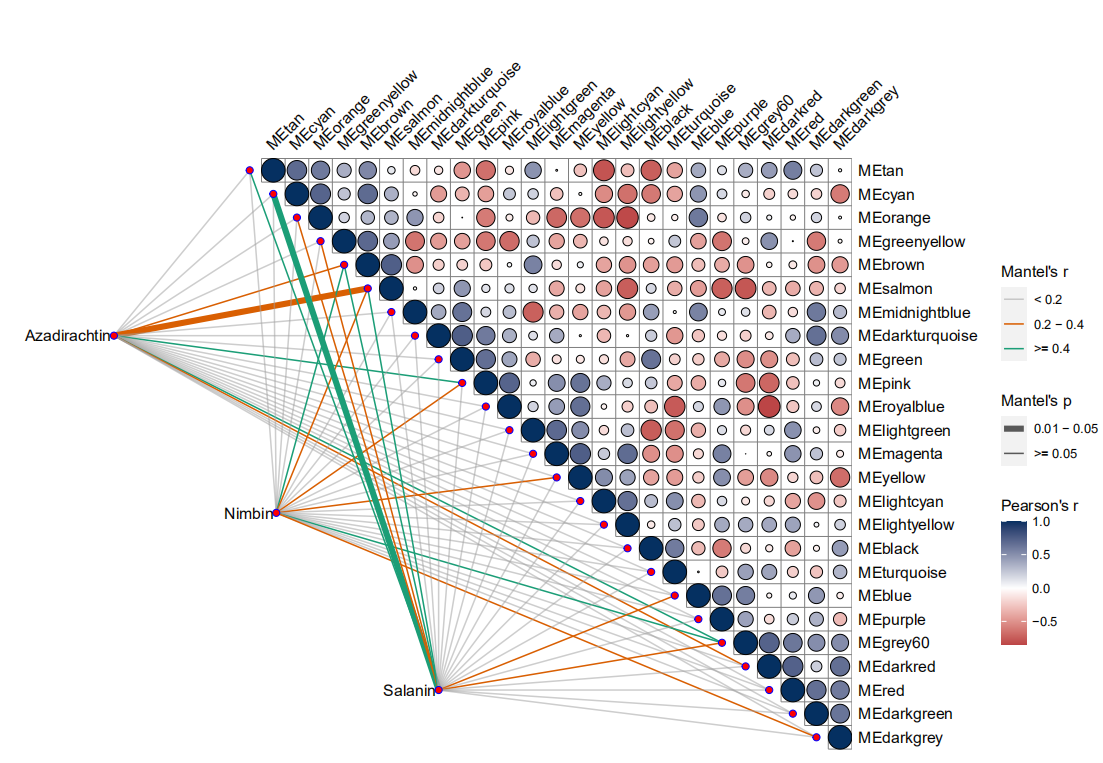
library(WGCNA)library(tidyverse)gene_exp <- read.table(file = './genes.TMM.EXPR.matrix',row.names = 1)head(gene_exp)#view(gene_exp)sample_info <- read.table(file = './sample_information.txt',row.names = 1)head(sample_info)#view(sample_info)# 转置datExpr0 <- t(gene_exp)head(datExpr0)# 缺失数据及无波动数据过滤gsg <- goodSamplesGenes(datExpr0,minFraction = 1/2 #基因的缺失数据比例阈值)datExpr <- datExpr0[gsg$goodSamples, gsg$goodGenes]dim(datExpr)datExpr[1:6, 1:3]# 通过聚类,查看是否有明显异常样本, 如果有需要剔除掉plot(hclust(dist(datExpr)),cex.lab = 1.5,cex.axis = 1.5,cex.main = 2)datTraits <- sample_infodatTraitsdatTraits[1:6, 1:3] #这个表格的样品顺序必须和上面的datExpr[1:6, 1:3]数据顺序相同library(WGCNA)# 多线程enableWGCNAThreads(nThreads = 32)# 通过对 power 的多次迭代,确定最佳 powersft <- pickSoftThreshold(datExpr,powerVector = 1:40, # 尝试 1 到 20networkType = "unsigned")head(sft)save(sft,file="sft.rdata")load(file = "./sft.rdata")# 画图library(ggplot2)library(ggrepel)library(cowplot)library(ggthemes)fig_power1 <- ggplot(data = sft$fitIndices,aes(x = Power,y = SFT.R.sq)) +geom_point(color = 'red') +geom_text_repel(aes(label = Power)) +geom_hline(aes(yintercept = 0.85), color = 'red') +labs(title = 'Scale independence',x = 'Soft Threshold (power)',y = 'Scale Free Topology Model Fit,signed R^2') +theme_few() +theme(plot.title = element_text(hjust = 0.5))fig_power2 <- ggplot(data = sft$fitIndices,aes(x = Power,y = mean.k.)) +geom_point(color = 'red') +geom_text_repel(aes(label = Power)) +labs(title = 'Mean connectivity',x = 'Soft Threshold (power)',y = 'Mean Connectivity') +theme_few()+theme(plot.title = element_text(hjust = 0.5))plot_grid(fig_power1, fig_power2)p2 <- plot_grid(fig_power1, fig_power2)ggsave("p2.pdf", p2, width = 9, height = 6, dpi=300)##########################################################################net <- blockwiseModules(# 0.输入数据datExpr,# 1. 计算相关系数corType = "pearson", # 相关系数算法,pearson|bicor# 2. 计算邻接矩阵power = 19, # 前面得到的 soft powernetworkType = "unsigned", # unsigned | signed | signed hybrid# 3. 计算 TOM 矩阵TOMType = "unsigned", # none | unsigned | signedsaveTOMs = TRUE,saveTOMFileBase = "blockwiseTOM",# 4. 聚类并划分模块deepSplit = 2, # 0|1|2|3|4, 值越大得到的模块就越多越小minModuleSize = 30,# 5. 合并相似模块## 5.1 计算模块特征向量(module eigengenes, MEs),即 PC1## 5.2 计算 MEs 与 datTrait 之间的相关性## 5.3 对距离小于 mergeCutHeight (1-cor)的模块进行合并mergeCutHeight = 0.25,# 其他参数numericLabels = FALSE, # 以数字命名模块nThreads = 0, # 0 则使用所有可用线程maxBlockSize = 100000 # 需要大于基因的数目)# 查看每个模块包含基因数目table(net$colors)save(net,file="net.rdata")load(file = "./net.rdata")#$$$$net3 <- blockwiseModules(# 0.输入数据datExpr,# 1. 计算相关系数corType = "pearson", # 相关系数算法,pearson|bicor# 2. 计算邻接矩阵power = 19, # 前面得到的 soft powernetworkType = "unsigned", # unsigned | signed | signed hybrid# 3. 计算 TOM 矩阵TOMType = "unsigned", # none | unsigned | signedsaveTOMs = TRUE,saveTOMFileBase = "blockwiseTOM",# 4. 聚类并划分模块deepSplit = 3, # 0|1|2|3|4, 值越大得到的模块就越多越小minModuleSize = 30,# 5. 合并相似模块## 5.1 计算模块特征向量(module eigengenes, MEs),即 PC1## 5.2 计算 MEs 与 datTrait 之间的相关性## 5.3 对距离小于 mergeCutHeight (1-cor)的模块进行合并mergeCutHeight = 0.25,# 其他参数numericLabels = FALSE, # 以数字命名模块nThreads = 0, # 0 则使用所有可用线程maxBlockSize = 100000 # 需要大于基因的数目)# 查看每个模块包含基因数目table(net3$colors)save(net3,file="net3.rdata")load(file = "./net3.rdata")#$$$$$$net4 <- blockwiseModules(# 0.输入数据datExpr,# 1. 计算相关系数corType = "pearson", # 相关系数算法,pearson|bicor# 2. 计算邻接矩阵power = 19, # 前面得到的 soft powernetworkType = "unsigned", # unsigned | signed | signed hybrid# 3. 计算 TOM 矩阵TOMType = "unsigned", # none | unsigned | signedsaveTOMs = TRUE,saveTOMFileBase = "blockwiseTOM",# 4. 聚类并划分模块deepSplit = 4, # 0|1|2|3|4, 值越大得到的模块就越多越小minModuleSize = 30,# 5. 合并相似模块## 5.1 计算模块特征向量(module eigengenes, MEs),即 PC1## 5.2 计算 MEs 与 datTrait 之间的相关性## 5.3 对距离小于 mergeCutHeight (1-cor)的模块进行合并mergeCutHeight = 0.25,# 其他参数numericLabels = FALSE, # 以数字命名模块nThreads = 0, # 0 则使用所有可用线程maxBlockSize = 100000 # 需要大于基因的数目)# 查看每个模块包含基因数目table(net4$colors)save(net4,file="net4.rdata")load(file = "./net4.rdata")##################################################library(tidyverse)wgcna_result <- data.frame(gene_id = names(net$colors),module = net$colors)dim(wgcna_result)plotDendroAndColors(dendro = net$dendrograms[[1]],colors = net$colors,groupLabels = "Module colors",dendroLabels = FALSE,addGuide = TRUE)p4 <- plotDendroAndColors(dendro = net$dendrograms[[1]],colors = net$colors,groupLabels = "Module colors",dendroLabels = FALSE,addGuide = TRUE)p4ggsave("p4.pdf", p4, width = 20, height = 10, dpi=300)moduleTraitCor <- cor(net$MEs,datTraits,use = "p",method = 'pearson' # 注意相关系数计算方式)# 计算 PvaluemoduleTraitPvalue <- corPvalueStudent(moduleTraitCor,nrow(datExpr))# 相关性 heatmapsizeGrWindow(10,6)# 连接相关性和 pvaluetextMatrix <- paste(signif(moduleTraitCor, 2), "\n(",signif(moduleTraitPvalue, 1), ")", sep = "");dim(textMatrix) <- dim(moduleTraitCor)# heatmap 画图par(mar = c(6, 8.5, 3, 3))labeledHeatmap(Matrix = moduleTraitCor,xLabels = names(datTraits),yLabels = names(net$MEs),ySymbols = names(net$MEs),colorLabels = FALSE,colors = greenWhiteRed(50),textMatrix = textMatrix,setStdMargins = FALSE,cex.text = 0.5,zlim = c(-1,1),main = paste("Module-trait relationships"))dim(moduleTraitCor)head(moduleTraitCor)MET2 <- net$MEsMET <- orderMEs(cbind(net$MEs, dplyr::select(datTraits, Azadirachtin)))head(MET)plotEigengeneNetworks(multiME = MET,setLabels = "Eigengene dendrogram",plotDendrograms = TRUE,plotHeatmaps = FALSE,colorLabels = TRUE,marHeatmap = c(3,4,2,2))plotEigengeneNetworks(multiME = MET2,setLabels = "Eigengene dendrogram",plotDendrograms = FALSE,plotHeatmaps = TRUE,colorLabels = TRUE,marHeatmap = c(8,8,2,2))head(MET)# 需要导出的模块my_modules <- c('yellow')# 提取该模块的表达矩阵filter(wgcna_result, module == my_modules)m_wgcna_result <- filter(wgcna_result, module %in% my_modules)head(m_wgcna_result)m_wgcna_resultm_datExpr <- datExpr[, m_wgcna_result$gene_id]# 计算该模块的 TOM 矩阵m_TOM <- TOMsimilarityFromExpr(m_datExpr,power = 6,networkType = "unsigned",TOMType = "unsigned")head(m_TOM)dimnames(m_TOM) <- list(colnames(m_datExpr), colnames(m_datExpr))#####################################################################library(dplyr)#BiocManager::install("vegan")library(vegan)library(ggplot2)#devtools::install_git("https://gitee.com/dr_yingli/ggcor")library(ggcor)packageVersion('ggcor')#view(MET2)head(MET2)#view(sample_info)head(sample_info)quickcor(MET2) + geom_square()quickcor(MET2, type = "upper") + geom_circle2()quickcor(MET2, type = "full", cor.test = TRUE) + geom_circle2()quickcor(MET2, type = "upper", cor.test = TRUE) + geom_circle2()corr <- fortify_cor(MET2, type = "upper", show.diag = TRUE,cor.test = TRUE, cluster.type = "all")mantel <- mantel_test( sample_info,MET2,spec.select = list(spec01 = 1,spec02 = 2,spec03 = 3),mantel.fun = "mantel.randtest")mantel2 <- mantel_test(sample_info,MET2,spec.select = list(Spec01 = 1,Spec02 = 2,Spec03 = 3)) %>%mutate(rd = cut(r, breaks = c(-Inf, 0.2, 0.4, Inf),labels = c("< 0.2", "0.2 - 0.4", ">= 0.4")),pd = cut(p.value, breaks = c(-Inf, 0.01, 0.05, Inf),labels = c("< 0.01", "0.01 - 0.05", ">= 0.05")))head(mantel2)mantel3 <- mantel_test(sample_info,MET2,spec.select = list(Azadirachtin = 1,Nimbin = 2,Salanin = 3)) %>%mutate(rd = cut(r, breaks = c(-Inf, 0.2, 0.4, Inf),labels = c("< 0.2", "0.2 - 0.4", ">= 0.4")),pd = cut(p.value, breaks = c(-Inf, 0.001,0.01, 0.05, Inf),labels = c("< 0.001","0.001-0.01", "0.01 - 0.05", ">= 0.05")))view(mantel3)library(ggcor)quickcor(corr, type = "upper") +geom_square() +anno_link(aes(colour = pd, size = rd), data = mantel2) +scale_size_manual(values = c(0.5, 1, 2))+guides(size = guide_legend(title = "Mantel's r",order = 2),colour = guide_legend(title = "Mantel's p",order = 1),fill = guide_colorbar(title = "Pearson's r", order = 3))quickcor(corr, type = "upper") +geom_circle2() +anno_link(aes(colour = pd, size = rd), data = mantel3) +scale_size_manual(values = c(0.5, 1, 2))+guides(size = guide_legend(title = "Mantel's r",order = 2),colour = guide_legend(title = "Mantel's p",order = 1),fill = guide_colorbar(title = "Pearson's r", order = 3))quickcor(corr,type="upper") + geom_circle2(scale_fill_manual(values = c("red","gray","green")))quickcor(corr, type = "upper") +geom_circle2(colour = "black") +anno_link(aes(colour = rd, size = pd), data = mantel3) +scale_size_manual(values = c(0.5, 1, 2))+guides(size = guide_legend(title = "Mantel's p",order = 2),colour = guide_legend(title = "Mantel's r",order = 1),fill = guide_colorbar(title = "Pearson's r", order = 3))+scale_size_manual(values = c(2, 0.5))+scale_colour_manual(values = c("#A2A2A288","#D95F02", "#1B9E77")) +scale_fill_gradient2(midpoint = 0, low = "#A91529", mid = "white",high = "#053061", space = "Lab" )################################################################################quickcor(corr, type = "upper") +geom_circle2(colour = "black") +anno_link(aes(colour = rd, size = pd), data = mantel3) +scale_size_manual(values = c(0.5, 1, 2))+guides(size = guide_legend(title = "Mantel's p",order = 2),colour = guide_legend(title = "Mantel's r",order = 1),fill = guide_colorbar(title = "Pearson's r", order = 3))+scale_size_manual(values = c(2, 0.5))+scale_colour_manual(values = c("#A2A2A288","#D95F02", "#1B9E77"))#测试数据library(tidyverse)library(ggcor)data("varechem", package = "vegan")view(varechem)dim(varechem)data("varespec", package = "vegan")view(varespec)dim(varespec)mantel <- mantel_test(varespec, varechem,spec.select = list(Spec01 = 1:7,Spec02 = 8:18,Spec03 = 19:37,Spec04 = 38:44)) %>%mutate(rd = cut(r, breaks = c(-Inf, 0.2, 0.4, Inf),labels = c("< 0.2", "0.2 - 0.4", ">= 0.4")),pd = cut(p.value, breaks = c(-Inf, 0.01, 0.05, Inf),labels = c("< 0.01", "0.01 - 0.05", ">= 0.05")))head(mantel)quickcor(varechem, type = "upper") +geom_square() +anno_link(aes(colour = pd, size = rd), data = mantel) +scale_size_manual(values = c(0.5, 1, 2))+guides(size = guide_legend(title = "Mantel's r",order = 2),colour = guide_legend(title = "Mantel's p",order = 1),fill = guide_colorbar(title = "Pearson's r", order = 3))

##########################################################################
#KEGG富集分析
# 需要导出的模块
my_modules <- c('brown')
# 提取该模块的表达矩阵
filter(wgcna_result, module == my_modules)
mRNA_wgcna <- filter(wgcna_result, module %in% my_modules)%>% pull(gene_id)
view(mRNA_wgcna)
dim(mRNA_wgcna)
class(mRNA_wgcna)

emapper <- read_delim('./3_canu_genome.eggnog.mapper.result.emapper.annotations',
                      "\t", escape_double = FALSE, col_names = FALSE,
                      comment = "#", trim_ws = TRUE) %>%
  dplyr::select(GID = X1,
                KO = X9,
                Pathway = X10)
view(emapper)

pathway2gene <- dplyr::select(emapper, Pathway, GID) %>%
  separate_rows(Pathway, sep = ',', convert = F) %>%
  filter(str_detect(Pathway, 'ko')) %>%
  mutate(Pathway = str_remove(Pathway, 'ko'))
pathway2gene
view(pathway2gene)


library(magrittr)
get_path2name <- function(){
  keggpathid2name.df <- clusterProfiler:::kegg_list("pathway")
  keggpathid2name.df[,1] %<>% gsub("path:map", "", .)
  colnames(keggpathid2name.df) <- c("path_id","path_name")
  return(keggpathid2name.df)
}
pathway2name <- get_path2name()


library(magrittr)
library(clusterProfiler)
get_path2name <- function(){
  keggpathid2name.df <- clusterProfiler:::kegg_list("pathway")
  keggpathid2name.df[,1] %<>% gsub("path:map", "", .)
  colnames(keggpathid2name.df) <- c("path_id","path_name")
  return(keggpathid2name.df)
}
pathway2name <- get_path2name()
pathway2name


library(clusterProfiler)
de_ekp <- enricher(mRNA_wgcna,
                   TERM2GENE = pathway2gene,
                   TERM2NAME = pathway2name,
                   pvalueCutoff = 0.05,
                   qvalueCutoff = 0.05)
de_ekp
class(de_ekp)
de_ekp_df <- as.data.frame(de_ekp)
head(de_ekp_df)

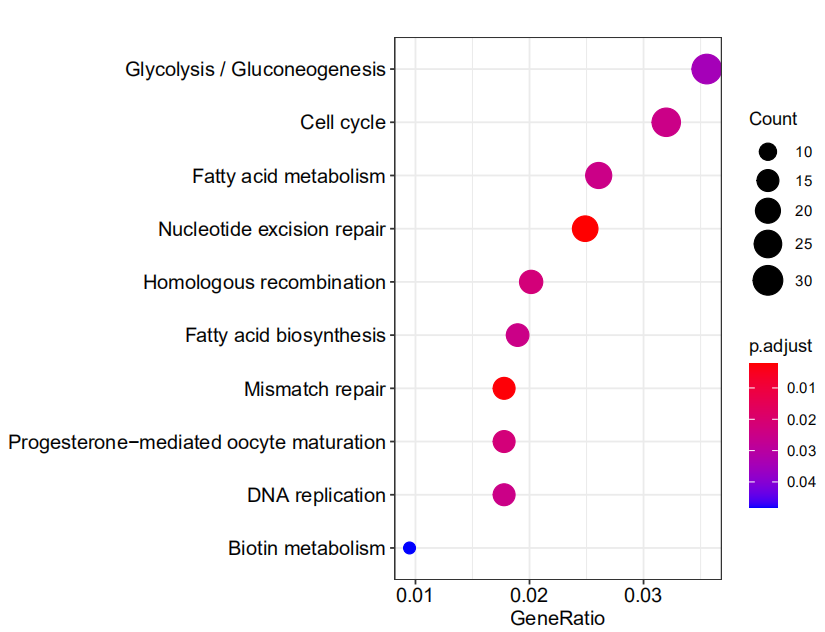
barplot(de_ekp,showCategory = 10)
dotplot(de_ekp)
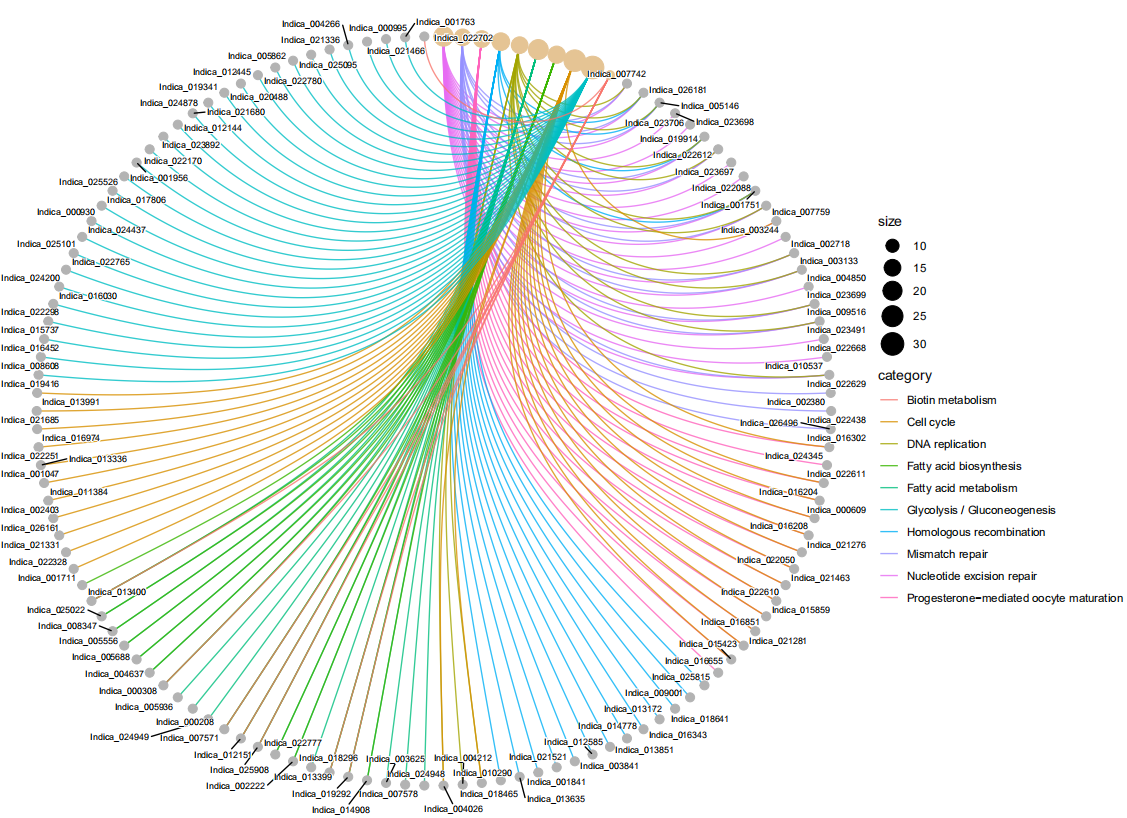
cnetplot(de_ekp,showCategory = 10,node_label = "gene",#category | gene|all|none
         circular=TRUE,colorEdge=TRUE)
?cnetplot
cnetplot(de_ekp,showCategory = 10,node_label = "gene",#category | gene|all|none
         circular=TRUE,colorEdge=TRUE,cex_label_gene = 0.5,cex_label_category=0.8)


##########################################################################
#GO富集分析
library(argparser)
library(AnnotationForge)
library(AnnotationForge)
library(GO.db)
dir.create('R_Library', recursive = T)
#(R_env_1) dell@dell-server:~/桌面/kegg_go_plot_result/kegg_plot$ Rscript  emcp/create_orgdb_from_emapper.R  3_canu_genome.eggnog.mapper.result.emapper.annotations
#dir.create('R_Library', recursive = T)
# 将包安装在该文件夹下
install.packages('./org.My.eg.db_1.0.tar.gz',repos = NULL, #从本地安装
                 lib = 'R_Library') # 安装文件夹
# 加载 OrgDB
library(org.My.eg.db, lib = 'R_Library')


# 需要导出的模块
my_modules <- c('brown')
# 提取该模块的表达矩阵
filter(wgcna_result, module == my_modules)
mRNA_wgcna <- filter(wgcna_result, module %in% my_modules)%>% pull(gene_id)
view(mRNA_wgcna)
dim(mRNA_wgcna)
class(mRNA_wgcna)


de_ego <- enrichGO(gene = mRNA_wgcna,
                   OrgDb = org.My.eg.db,
                   keyType = 'GID',
                   ont = 'ALL',
                   qvalueCutoff = 0.05,
                   pvalueCutoff = 0.05)

de_ego_df <- as.data.frame(de_ego)
head(de_ego_df)
#$$
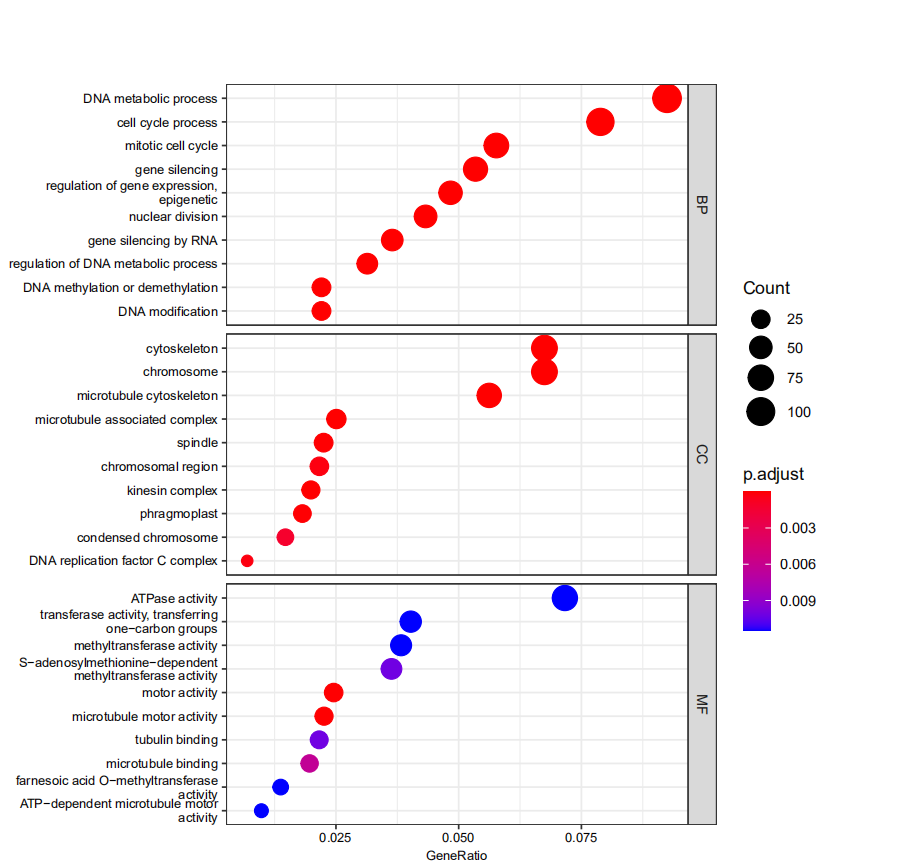
barplot(de_ego, showCategory = 10, split="ONTOLOGY") +
  facet_grid(ONTOLOGY~., scale="free") + scale_y_discrete(labels=function(y) stringr::str_wrap(y,width=36))


dotplot(de_ego, showCategory = 10, split="ONTOLOGY",font.size = 8) +
  facet_grid(ONTOLOGY~., scale="free")+ scale_y_discrete(labels=function(y) stringr::str_wrap(y,width=36))

p2 <- cnetplot(de_ego,showCategory = 5,node_label = "gene",#category | gene|all|none
               circular=TRUE,colorEdge=TRUE,cex_label_gene = 0.5,cex_label_category=0.8,cex_gene=0.6,cex_category = 0.6)+ scale_y_discrete(labels=function(y) stringr::str_wrap(y,width=36))


p4 <- plot_grid(p1,p2,labels = "Chrom14 GO pathway enrichment",label_size = 14,label_fontface = "bold",label_x = -0.2,label_y = 1)
ggsave("chrom14_GO.pdf", p4, width = 13, height = 6, dpi=300)


标签:
bioinfo
北京 天气
晴
0℃


