R语言编程
20240506_Minimap2软件比对结果的可视化方法
632

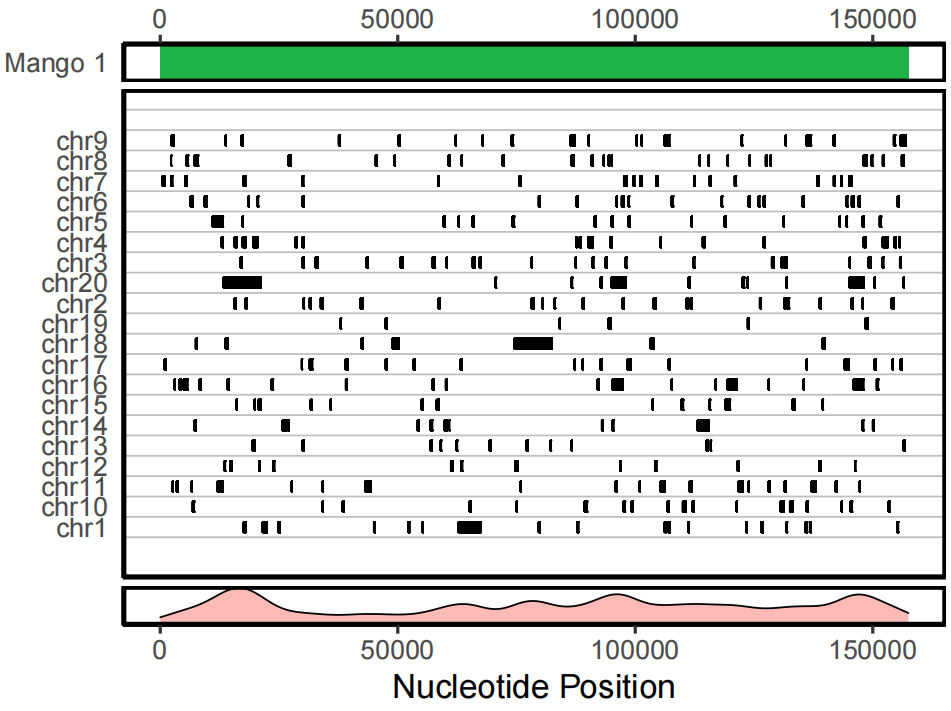
Minimap2 是一款广泛使用的序列比对工具,它能够高效地处理大规模的基因组数据,特别是在长读长测序技术中表现出色。该软件通过精确比对DNA或RNA序列到参考基因组,帮助研究人员快速定位序列变异和结构变化,是现代基因组研究和比较基因组学的重要工具。尽管Minimap2能够提供详尽的比对结果,但这些结果通常以文本形式出现,对于希望直观理解比对信息的研究人员来说可能难以解读。因此,将这些比对结果进行可视化变得极为重要。在本文中,我们将介绍如何使用具体的方法,将Minimap2的比对结果转化为直观的图形,这种图形表达方式有助于清晰地展示出各个染色体上与参考序列相比对的序列位置和密度,使得研究人员可以快速识别出高度保守的区域以及潜在的结构变异。
(1)比对序列、参考序列与相关代码的准备
(base) root@dell-server:/home/dell/chlomito_to_chrom_minimap2/mangguo_result# cp /home/newdisk_dell_6/wilson/lizi/lizi_organelle_identify_result_20221125/lizi_flye_identified_result/chloroplast_minimap2_chromosome/minimap2_result_visulation-main.py  ./

(base) root@dell-server:/home/dell/chlomito_to_chrom_minimap2/mangguo_result# cp /home/newdisk_dell_6/wilson/lizi/lizi_organelle_identify_result_20221125/lizi_flye_identified_result/chloroplast_minimap2_chromosome/minimap2_result_visulation.R  ./

(base) root@dell-server:/home/dell/chlomito_to_chrom_minimap2/mangguo_result# cp /home/newdisk_dell/wilson_2/mangguo_result/2022-03-30-02-56-55_result/hicpro-allhic/11_circos_plot-hicpro-allhic/plot_result/chromosome.fasta ./mangguo_chromosome.fasta

(base) root@dell-server:/home/dell/chlomito_to_chrom_minimap2/mangguo_result# cp ../mango_chlo_98267_split_junction.fasta   mangguo_chloroplast.fasta
(base) root@dell-server:/home/dell/chlomito_to_chrom_minimap2/mangguo_result# ls -lhtr
总用量 353M
-rw-r--r-- 1 root root 3.4K 5月   6 01:56 minimap2_result_visulation-main.py
-rw-r--r-- 1 root root 353M 5月   6 02:25 mangguo_chromosome.fasta
-rw-r--r-- 1 root root 154K 5月   6 02:27 mangguo_chloroplast.fasta
-rw-r--r-- 1 root root 2.3K 5月   6 02:58 minimap2_result_visulation.R
(2)minimap2比对结果的可视化
(base) root@dell-server:/home/dell/chlomito_to_chrom_minimap2/mangguo_result# python minimap2_result_visulation-main.py  mangguo_chloroplast.fasta mangguo_chromosome.fasta    mangguo_chloroplast_minimap2_chromosome_result-2
(base) root@dell-server:/home/dell/chlomito_to_chrom_minimap2/mangguo_result# ls -lhtr
总用量 353M
-rw-r--r-- 1 root root 3.4K 5月   6 01:56 minimap2_result_visulation-main.py
-rw-r--r-- 1 root root 353M 5月   6 02:25 mangguo_chromosome.fasta
-rw-r--r-- 1 root root 154K 5月   6 02:27 mangguo_chloroplast.fasta
-rw-r--r-- 1 root root  908 5月   6 02:27 command.txt
-rw-r--r-- 1 root root 2.3K 5月   6 02:58 minimap2_result_visulation.R
drwxr-xr-x 3 root root 4.0K 5月   6 02:58 mangguo_chloroplast_minimap2_chromosome_result-2

(3)Python 与 Rscript代码
(base) root@dell-server:/home/dell/chlomito_to_chrom_minimap2/mangguo_result# cat minimap2_result_visulation-main.py
import os
import sys
from numpy import *
import math
import numpy as np

database = sys.argv[1]
query = sys.argv[2]
output = sys.argv[3]
os.system('rm -rf %s && mkdir %s'%(output,output))
os.chdir('%s'%(output))
os.system('cp ../%s ../%s ./'%(database,query))
os.system('cut -d " " -f 1 %s > database_oneline.fasta'%(database))
os.system('cut -d " " -f 1 %s > query_oneline.fasta'%(query))
database = "database_oneline.fasta"
query = "query_oneline.fasta"

os.system('grep  ">" %s | cut -d ">" -f 2 > contig.id '%(query))
app_tmp_0 = open("./contig.id","r").read().strip().split("\n")


os.system('samtools faidx %s'%(database))
contig_length_dic = {}
for eles in open("database_oneline.fasta.fai").read().strip().split("\n") :
    ele = eles.strip().split("\t")
    contig_length_dic[ ele[0].strip() ] = ele[1].strip()
print(contig_length_dic)
#os.system('cp ../../%s/mito_genome.fasta  ./'%(organelle_db))
#os.system(' minimap2  mito_genome.fasta  %s  -t 30 > mito-genome.blast.result.paf  '%(assembled_genome))
#os.system(' minimap2  %s  %s  -t 30 > mito-genome.blast.result.paf  '%(database,query))
os.system(' minimap2  %s  %s  -t 30 |  awk \'{print $1"\t"$2"\t"$6"\t"$7"\t""100""\t"$10"\t"$3"\t"$4"\t"$8"\t"$9}\' -  > mito-genome.blast.result.txt  '%(database,query))
filein = "mito-genome.blast.result.txt" # blastn result
def each_contig_in_database(target_contig) :
    os.system('rm -rf %s && mkdir %s'%(target_contig,target_contig))
    os.chdir('%s'%(target_contig))
    os.system('cp ../%s ./'%(filein) )
    filein2 = filein + "2"
    os.system(' sort -k 1  -n -k 7 -n -k 8 %s  |awk \'{if ($6 > 50 && $3 == "%s"  )  print }\'  > %s  '%(filein,target_contig, filein2))
    os.system(' awk  -F "\t"  \'{print $0 > $1".txt"}\'  %s   '%(filein2))
    list0 = os.popen('ls ').read().strip().split("\n")
    list0.remove(filein)
    list0.remove(filein2)
    print(list0)
    def mapped_length_calculate(tmpfile) :
        eles = open(tmpfile).read().strip().split("\n")
        bb = []
        i = 0
        for ele in eles :
            start = ele.strip().split("\t")[8]
            end = ele.strip().split("\t")[9]
            aa = list( np.arange(int(start),int(end) ))
            bb.extend(aa)
            i = i + 1
        cc_tmp = list(set(bb))
        cc = sorted(cc_tmp)
        for ele2 in cc :
            with open(tmpfile + "-tmp", "a+") as f :
                f.write(  tmpfile.strip().split(".txt")[0].strip() + "\t" + str(ele2) +  "\n" )
                #f.write(  str(ele2) +  "\n" )
    for ele3 in list0 :
        mapped_length_calculate(ele3)
    os.system('cat *-tmp  | sed  \'1i seq\tposition \' > final_result-plot.txt')
    os.system('cp ../../minimap2_result_visulation.R  ./')
    input_1 = "final_result-plot.txt"
    contig_name = target_contig
    contig_length_input = contig_length_dic[target_contig]
    output_1 = target_contig + "-1.pdf"
    output_2 = target_contig + "-2.pdf"
    os.system(' docker run  -v /var/run/docker.sock:/var/run/docker.sock -v `pwd`:/data -w /data  minimap2_result_visualization_docker_image  Rscript minimap2_result_visulation.R  %s %s %s %s %s '%( input_1, contig_name, contig_length_input, output_1, output_2  ))
    os.chdir('../')
os.system('grep  ">" %s | cut -d ">" -f 2 > database_contig.id '%(database))
database_tmp_0 = open("./database_contig.id","r").read().strip().split("\n")
for eles in database_tmp_0 :
    each_contig_in_database(eles)
(base) root@dell-server:/home/dell/chlomito_to_chrom_minimap2/mangguo_result# ccat minimap2_result_visulation.R
library(ggplot2)
library(scales)
library(patchwork)

Args <- commandArgs()
df  <- read.table(Args[6], sep="\t", header = TRUE )
head( df )
contig_name = Args[7]
#contig_length = Args[8]
contig_length = as.numeric( Args[8])
output_file_1 = Args[9]
output_file_2 = Args[10]


# 您原有的图表
plot1_tmp <- ggplot(df, aes(x = position, y = seq)) +
  geom_errorbar(aes(ymin = as.numeric(as.factor(seq)) - 0.25,
                    ymax = as.numeric(as.factor(seq)) + 0.25),
                width = 0) +
  #geom_hline(yintercept = seq(0.5, 16.5, 1), colour = "grey75") +
  geom_hline(yintercept = seq(0.5, 66, 1), colour = "grey75") +
  theme_classic(base_size = 20) +
  scale_y_discrete(expand = c(0.125, 0.125)) +
  theme(axis.title = element_blank(),
        axis.ticks.y = element_blank(),
        panel.border = element_rect(colour = "black", fill = NA, size = 2)) +
  coord_cartesian(xlim = c(0, contig_length))
ggsave(output_file_1, plot1_tmp , width = 8, height = 6 )


# 您原有的图表
plot1 <- ggplot(df, aes(x = position, y = seq)) +
  geom_errorbar(aes(ymin = as.numeric(as.factor(seq)) - 0.25,
                    ymax = as.numeric(as.factor(seq)) + 0.25),
                width = 0) +
  #geom_hline(yintercept = seq(0.5, 16.5, 1), colour = "grey75") +
  geom_hline(yintercept = seq(0.5, 66, 1), colour = "grey75") +
  theme_classic(base_size = 20) +
  scale_y_discrete(expand = c(0.125, 0.125)) +
  theme(axis.title = element_blank(),
        axis.ticks.y = element_blank(),
        axis.ticks.x = element_blank(),
        axis.text.x = element_blank(),
        panel.border = element_rect(colour = "black", fill = NA, size = 2)) +
  coord_cartesian(xlim = c(0, contig_length)) +
  theme(plot.margin = unit(c(0.3, 0, 0, 0), "lines"))  # 调整上、右、下、左边界


#######################################
density_plot <- ggplot(df, aes(x = position , fill = "red")) +
  geom_density(alpha = 0.5 ) +
  scale_x_continuous(limits = c(0, max(contig_length))) +
  theme_classic(base_size = 20) +
  theme(axis.title.y = element_blank(),
        #axis.text.x = element_blank(),
        axis.text.y = element_blank(),
        axis.ticks.y = element_blank(),
        #axis.ticks.x = element_blank(),
        panel.border = element_rect(colour = "black", fill = NA, size = 2),  # 设置面板边框
        legend.position = "none")  +
  labs(x = "Nucleotide Position") + theme(plot.margin = unit(c(0, 0, 0, 0), "lines"))  # 调整上、右、下、左边界

######################################
# 数据
df3 <- data.frame(x = factor(1), y = contig_length)
# 绘图
plot2 <- ggplot(df3, aes(x = x, y = y)) +
  geom_col(width = 2, fill = "#1FB24A") +  # 绘制柱状图
  coord_flip() +  # 柱状图水平显示
  theme_classic(base_size = 20) +  # 使用经典主题,并调整基本字体大小
  theme(
    axis.title = element_blank(),  # 不显示坐标轴标题
    axis.ticks.y = element_blank(),  # 不显示y轴刻度
    panel.border = element_rect(colour = "black", fill = NA, size = 2),  # 设置面板边框
    axis.text.y = element_text(hjust = 0),  # 将Y轴(原X轴)文本移动到右侧
    axis.text.x = element_text(vjust = 0.5)  # 将X轴(原Y轴)文本移动到顶端
  ) +
  scale_x_discrete(position = "bottom", labels = function(x) paste(contig_name, x))  + # x轴标签移到左侧,并提供标签
  scale_y_continuous(
    limits = c(0, contig_length),
    #labels = label_scientific(),  # 使用科学计数法格式化y轴标签
    position = "right"  # y轴标签移到右侧
  )+ theme(plot.margin = unit(c(0, 0, 0, 0), "lines"))  # 调整上、右、下、左边界


combined_plot <- plot2 /   plot1 / density_plot +
  plot_layout(heights = c(0.8, 10 , 0.8)) # 调整上下图表的相对高度
ggsave(output_file_2, combined_plot, width = 8, height = 6 )
标签:
rstudio
上一篇
没有了
北京 天气
晴
-7℃

