生物信息学
20230403_K-means聚类分析鉴定共表达基因及可视化
483

聚类分析用于将表达模式相同或相近的基因聚集成类,进而识别未知基因的功能或已知基因的未知功能,这些同类基因可能具有相似的功能,共同参与同一代谢过程或存在于同一细胞通路中。K-means称为K-均值聚类;k-means聚类的基本思想是根据预先设定的分类数目,在样本空间随机选择相应数目的点做为起始聚类中心点;然后将空间中到每个起始中心点距离最近的点作为一个集合,完成第一次聚类;获得第一次聚类集合所有点的平均值做为新的中心点,进行第二次聚类;直到得到的聚类中心点不再变化或达到尝试的上限,则完成了聚类过程。当样品较多时可以使用WGCNA方法分析,样品数量少可直接通过聚类分析如K-means、K-medoids (比K-means更稳定)或Hcluster或设定pearson correlation阈值来选择共表达基因。
生成测试数据:
#MixSim是用来评估聚类算法效率生成模拟数据集的一个R包。
#install.packages("MixSim")
library(MixSim)
library(tidyverse)
library(cluster)
library(factoextra)
library(ggplot2)
# 获得5个中心点,8维属性的数据模型
data = MixSim(MaxOmega=0,  K=5,  p=8,  ecc=0.5,  int=c(10, 100))
# 根据模型获得1000次观察的数据集
A <- simdataset(n=1000,  Pi=data$Pi, Mu=data$Mu, S=data$S, n.out=0)
data <- A$X
# 数据标准化
data <- t(apply(data, 1, scale))
# 定义行列名字
rownames(data) <- paste("Gene", 1:1000, sep="_")
colnames(data) <- letters[1:8]
head(data)
> head(data)
dim(data)

(2)确定最佳的聚类数目
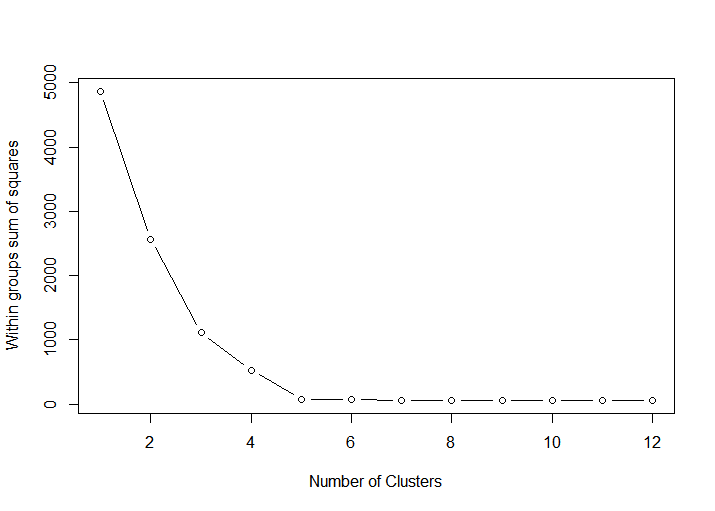
可通过遍历多个不同的聚类数计算其类内平方和的变化,并绘制线图,一般选择类内平方和降低开始趋于平缓的聚类数作为较优聚类数, 又称elbow算法。下图中拐点很明显是5,因此适合将测试数据聚为5个类群。
tested_cluster <- 12
wss <- (nrow(data)-1) * sum(apply(data, 2, var))
for (i in 2:tested_cluster) {
  wss[i] <- kmeans(data, centers=i,iter.max=100,  nstart=25)$tot.withinss
}
fviz_nbclust(data, kmeans, method = "wss") + theme_minimal() # 绘制手肘图
fviz_nbclust(data, kmeans, method = "gap_stat") + theme_minimal() # 绘制gap statistic图

plot(1:tested_cluster, wss, type="b", xlab="Number of Clusters", ylab="Within groups sum of squares")

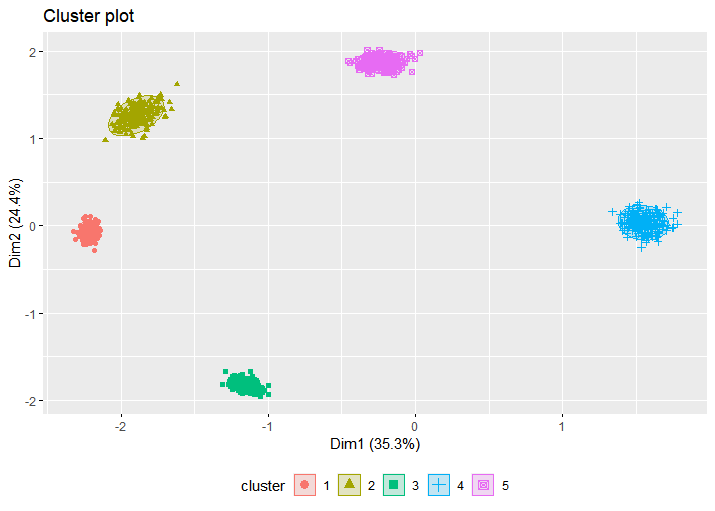
(3)使用K-means讲转录组数据聚为5类并进行可视化
library(cluster)
#install.packages("fpc")
library(fpc)
# iter.max: 最大迭代次数
# nstart: 选择的随机集的数目
# centers: 上一步推测出的最优类数目
center = 5
fit <- kmeans(data, centers=center, iter.max=100, nstart=25)
head(fit)
withinss <- fit$tot.withinss
head(withinss)
print(paste("Get withinss for the first run", withinss))
## [1] "Get withinss for the first run 44.381088289378"
try_count = 10
for (i in 1:try_count) {
  tmpfit <- kmeans(data, centers=center, iter.max=100, nstart=25)
  tmpwithinss <- tmpfit$tot.withinss
  print(paste(("The additional "), i, 'run, withinss', tmpwithinss))
  if (tmpwithinss < withinss){
    withins <- tmpwithinss
    fit <- tmpfit
  }
}
fit_cluster = fit$cluster
head(fit_cluster)
#clusplot(data, fit_cluster, shade=T, labels=5, lines=0, color=T, lty=4, main='K-means clusters')
fviz_cluster(fit, data, stand = FALSE, geom = "point", ellipse.type = "t", ggtheme = theme_gray()) + theme(legend.position = "bottom")

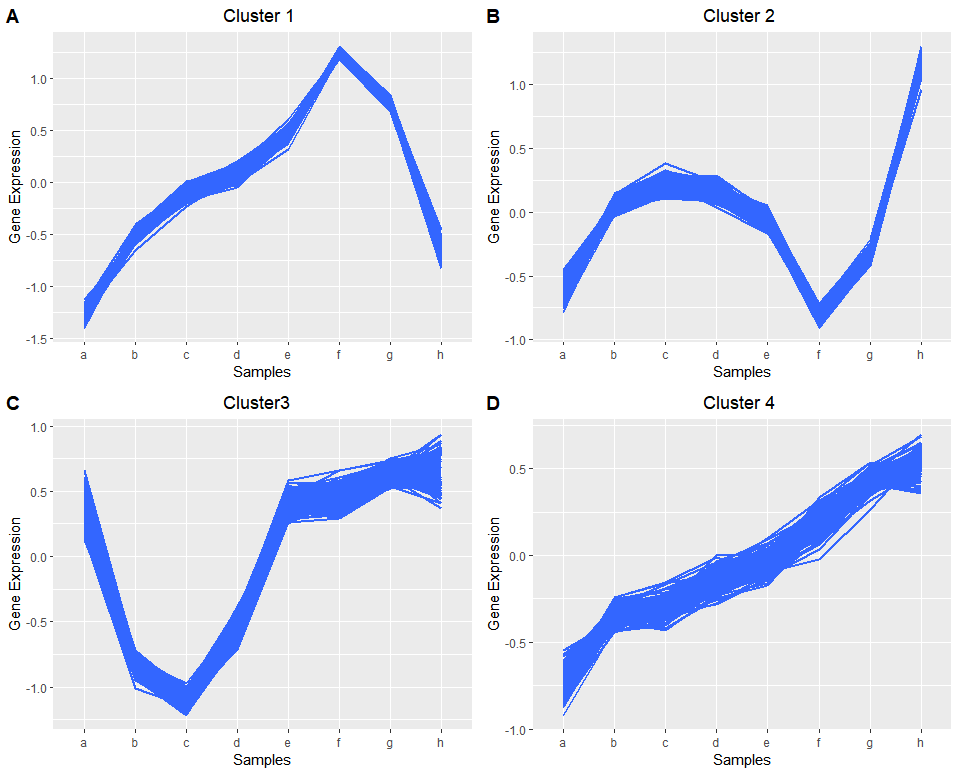
不同类群的基因的表达模式
cluster1 <- data[fit_cluster==1,]
head(cluster1)
cluster1 <- t(cluster1)
head(cluster1)
#view(cluster3)
library(tidyr)
data_long1 <- melt(cluster1,id.vars=c(cluster1$columns))
head(data_long1)
p1 <- ggplot(data_long1, aes(x=data_long1$Var1, y=data_long1$value,group=data_long1$Var2)) +
  stat_smooth(method="auto", se=FALSE) + theme(legend.position=c(0.85,0.2)) +
  labs(x="Samples", y="Gene Expression", title="                                  Cluster3")
p1

cluster2 <- data[fit_cluster==2,]
cluster2 <- t(cluster2)
data_long2 <- melt(cluster2,id.vars=c(cluster2$columns))
p2 <- ggplot(data_long2, aes(x=data_long2$Var1, y=data_long2$value,group=data_long2$Var2)) +
  stat_smooth(method="auto", se=FALSE) + theme(legend.position=c(0.85,0.2))+
  labs(x="Samples", y="Gene Expression", title="                                  Cluster 2")
p2
cluster3 <- data[fit_cluster==3,]
cluster3 <- t(cluster3)
data_long3 <- melt(cluster3,id.vars=c(cluster3$columns))
p3 <- ggplot(data_long3, aes(x=data_long3$Var1, y=data_long3$value,group=data_long3$Var2)) +
  stat_smooth(method="auto", se=FALSE) + theme(legend.position=c(0.85,0.2))+
  labs(x="Samples", y="Gene Expression", title="                                  Cluster 1")
p3

cluster4 <- data[fit_cluster==4,]
cluster4 <- t(cluster4)
data_long4 <- melt(cluster4,id.vars=c(cluster4$columns))
p4 <- ggplot(data_long4, aes(x=data_long4$Var1, y=data_long4$value,group=data_long4$Var2)) +
  stat_smooth(method="auto", se=FALSE) + theme(legend.position=c(0.85,0.2))+
  labs(x="Samples", y="Gene Expression", title="                                  Cluster 4")
p4
library(cowplot)
plot_grid(p1,p2,p3,p4,labels = LETTERS)

K-means之外的另一种聚类方法:K-medoids聚类
- K-means算法执行过程,首先需要随机选择起始聚类中心点,后续则是根据聚类结点算出平均值作为下次迭代的聚类中心点,迭代过程中计算出的中心点可能在观察数据中,也可能不在。如果选择的中心点是离群点 (outlier)的话,后续的计算就都被带偏了。而K-medoids在迭代过程中选择的中心点是类内观察到的数据中到其它点的距离最小的点,一定在观察点内。两者的差别类似于平均值和中值的差别,中值更为稳健。
- 围绕中心点划分(Partitioning Around Medoids,PAM)的方法是比较常用的(cluster::pam),与K-means相比,它有几个特征: 1.接受差异矩阵作为参数;2. 最小化差异度而不是欧氏距离平方和,结果更稳健;3. 引入silhouette plot评估分类结果,并可据此选择最优的分类数目; 4. fpc::pamk函数则可以自动选择最优分类数目,并根据数据集大小选择使用pam还是clara (方法类似于pam,但可以处理更大的数据集) 。
#不同的分类书计算出的silhouette值如下,越趋近于1说明分出的类越好。
fit_pam <- pamk(data, krange=2:10, critout=T)
##2  clusters  0.4424143
##3  clusters  0.6045024
##4  clusters  0.7619038
##5  clusters  0.9149682
##6  clusters  0.7533374
##7  clusters  0.6100874
##8  clusters  0.4581961
##9  clusters  0.2860856
##10  clusters  0.1200027

#获取需要聚类的类群的数目
fit_pam$nc
## [1] 5

fit_cluster <- fit_pam$pamobject$clustering
fit_cluster

fit <- pamk(data, 5)
fit
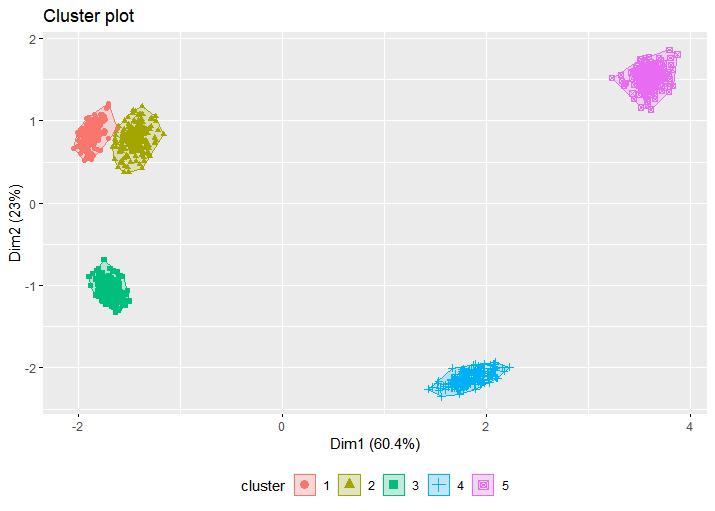
fviz_cluster(fit, data,  ggtheme = theme_gray()  , geom = "point"  ) + theme(legend.position = "bottom")

标签:
bioinfo
北京 天气
晴
0℃


