R语言编程
20230429_利用ggmagnify包优化R中ggplot2图形的局部可视化效果
907

ggmagnify软件包:
ggmagnify是一个R包,它用于在ggplot2图形中创建局部放大的效果。通过使用ggmagnify,你可以更加清楚地展示图中的一些特定区域,尤其是在数据点密集或者重叠较多的情况下。这个包可以和ggplot2无缝结合,让你在创建可视化时更加灵活。
ggplot2软件包:
ggplot2 是一个基于 R 语言的强大且灵活的数据可视化包,旨在帮助用户轻松创建丰富、美观且具有各种定制功能的统计图形。ggplot2 的核心组件包括以下几个方面:
- 数据(data):用于绘制图形的数据集,通常为数据框(data frame)格式。
- 几何对象(geoms):图形的基本形状,如点(point)、线(line)、柱(bar)、箱线图(boxplot)等。在 ggplot2 中,可以通过添加不同的几何对象来表示数据的各个方面。
- 映射(aesthetic mappings):将数据的变量映射到图形的视觉属性,如颜色、大小、形状等。这样可以用图形直观地展示数据的特征和关系。
- 标度(scales):用于控制图形的坐标轴和颜色尺度等。标度可以实现对数据的转换以及对图形属性的定制。
- 坐标系统(coordinate systems):控制图形的布局方式,例如笛卡尔坐标系、极坐标系等。
- 分面(faceting):将数据按照某个变量进行分组,创建一组子图。这有助于比较不同组间的关系和模式。
- 主题(themes):用于控制图形的外观和设计元素,如字体、背景颜色等。用户可以选择预设主题或自定义主题。
ggmagnify包安装步骤:
# 4.0.2版本R
# 4.2版本Rtools
# 从https://github.com/hughjonesd/ggmagnify网站下载ggmagnify软件包
# 本地安装
library(devtools)
devtools::install_local("ggmagnify-master.zip")
library(ggmagnify)
install.packages("lifecycle")
library(lifecycle)
install.packages("ggplot2")
library(ggplot2)
install.packages("ggfx")
library(ggfx)
ggmagnify包绘图步骤:
> head(diamonds)
# A tibble: 6 x 10
  carat cut       color clarity depth table price     x     y     z
  <dbl> <ord>     <ord> <ord>   <dbl> <dbl> <int> <dbl> <dbl> <dbl>
1  0.23 Ideal     E     SI2      61.5    55   326  3.95  3.98  2.43
2  0.21 Premium   E     SI1      59.8    61   326  3.89  3.84  2.31
3  0.23 Good      E     VS1      56.9    65   327  4.05  4.07  2.31
4  0.29 Premium   I     VS2      62.4    58   334  4.2   4.23  2.63
5  0.31 Good      J     SI2      63.3    58   335  4.34  4.35  2.75
6  0.24 Very Good J     VVS2     62.8    57   336  3.94  3.96  2.48
ggp <- ggplot(diamonds, aes(carat, depth, color = cut)) + geom_point()
ggp

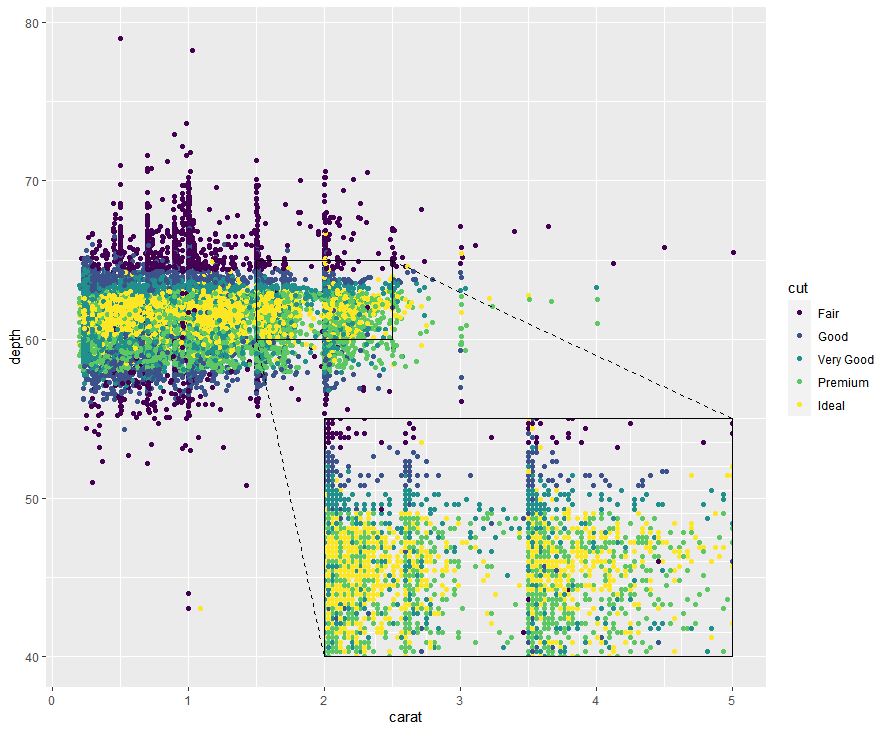
ggmagnify(ggp,
          xlim = c(1.5, 2.5), ylim = c(60, 65),
          inset_xlim = c(2, 5), inset_ylim = c(40, 55))
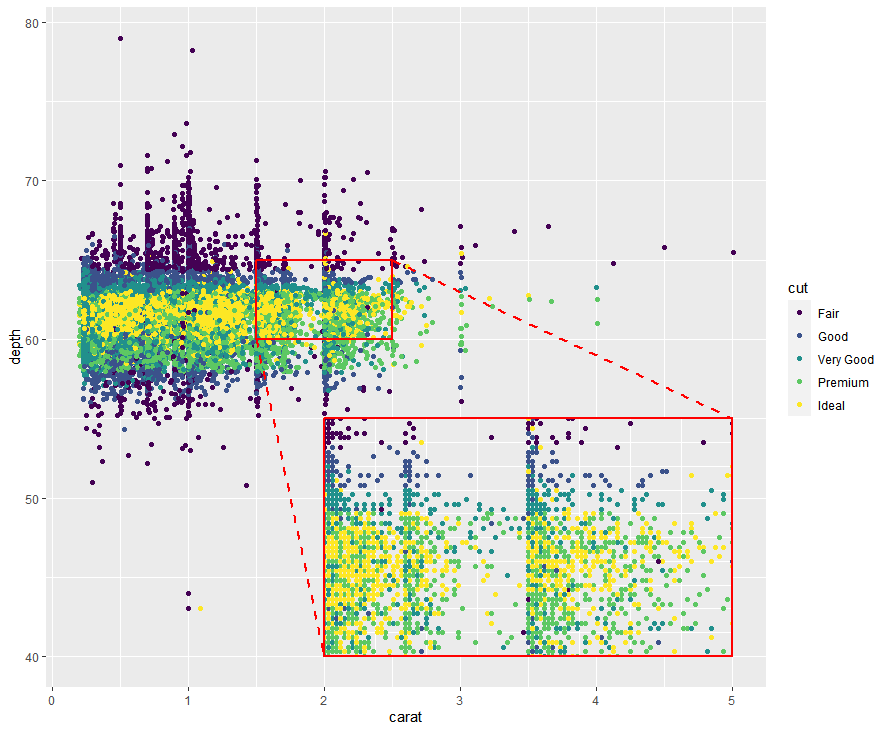
ggmagnify(ggp,
          xlim = c(1.5, 2.5), ylim = c(60, 65),
          inset_xlim = c(2, 5), inset_ylim = c(40, 55),
          #proj = "single",
          colour = "red", proj_linetype = 2, linewidth = 0.8)
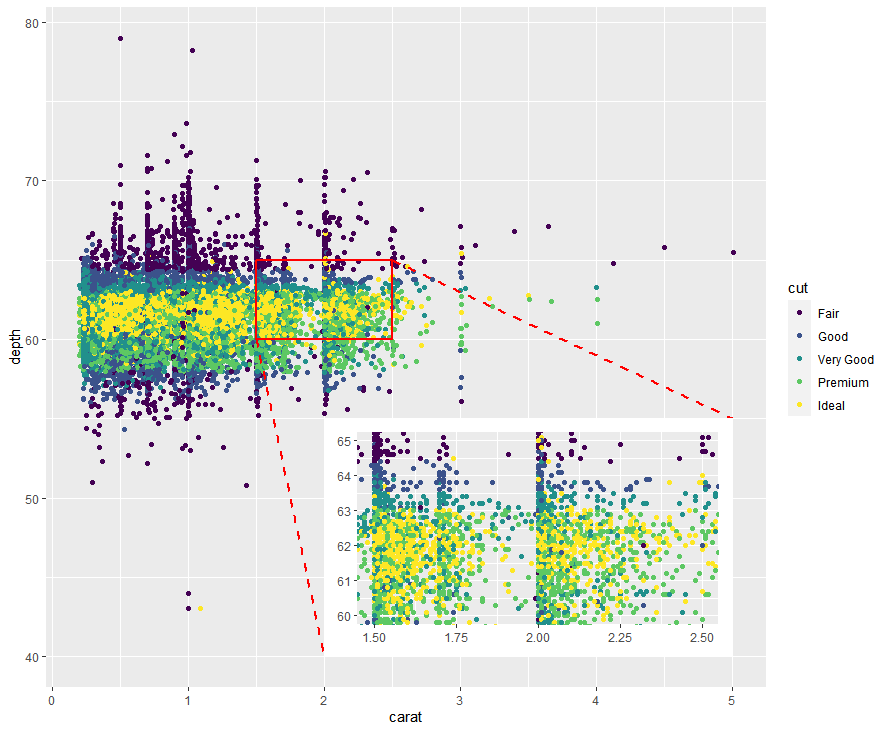
ggmagnify(ggp,
          xlim = c(1.5, 2.5), ylim = c(60, 65),
          inset_xlim = c(2, 5), inset_ylim = c(40, 55),
          #proj = "single",
          colour = "red", proj_linetype = 2, linewidth = 0.8,
          axes = TRUE, border = FALSE)
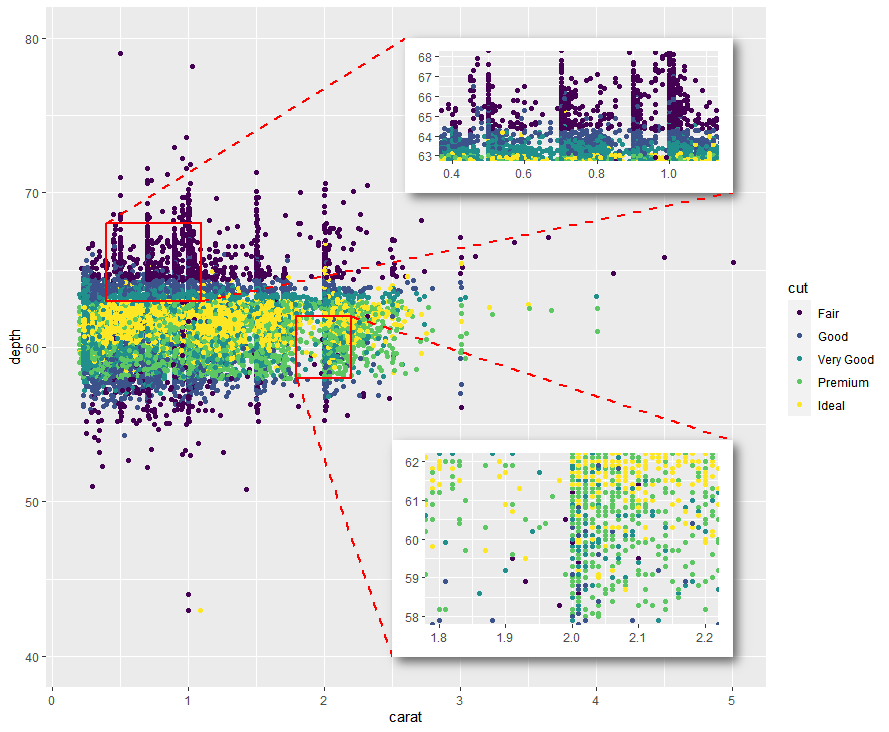
ggp <- ggplot(diamonds, aes(carat, depth, color = cut)) + geom_point()
ggp_noclip <- ggp +
  coord_cartesian(xlim = c(0, 5), ylim = c(40, 80), clip = "off") +
  theme(legend.justification = c(0, 1))
ggm1 <-ggmagnify(ggp_noclip,
          xlim = c(0.4, 1.1), ylim = c(63, 68),
          inset_xlim = c(2.6, 5), inset_ylim = c(70, 80),
          shadow = TRUE,
          colour = "red", proj_linetype = 2, linewidth = 0.8,
          axes = TRUE, border = FALSE)
ggm2 <-ggmagnify(ggp_noclip,
          xlim = c(1.8, 2.2), ylim = c(58, 62),
          inset_xlim = c(2.5, 5), inset_ylim = c(40, 54),
          shadow = TRUE,
          colour = "red", proj_linetype = 2, linewidth = 0.8,
          axes = TRUE, border = FALSE)
ggp <- compose( ggm1, ggp)
ggp <- compose( ggm2, ggp)
ggp
标签:
rstudio
北京 天气
晴
-7℃

